
Today's post will fire you boys UP!!!
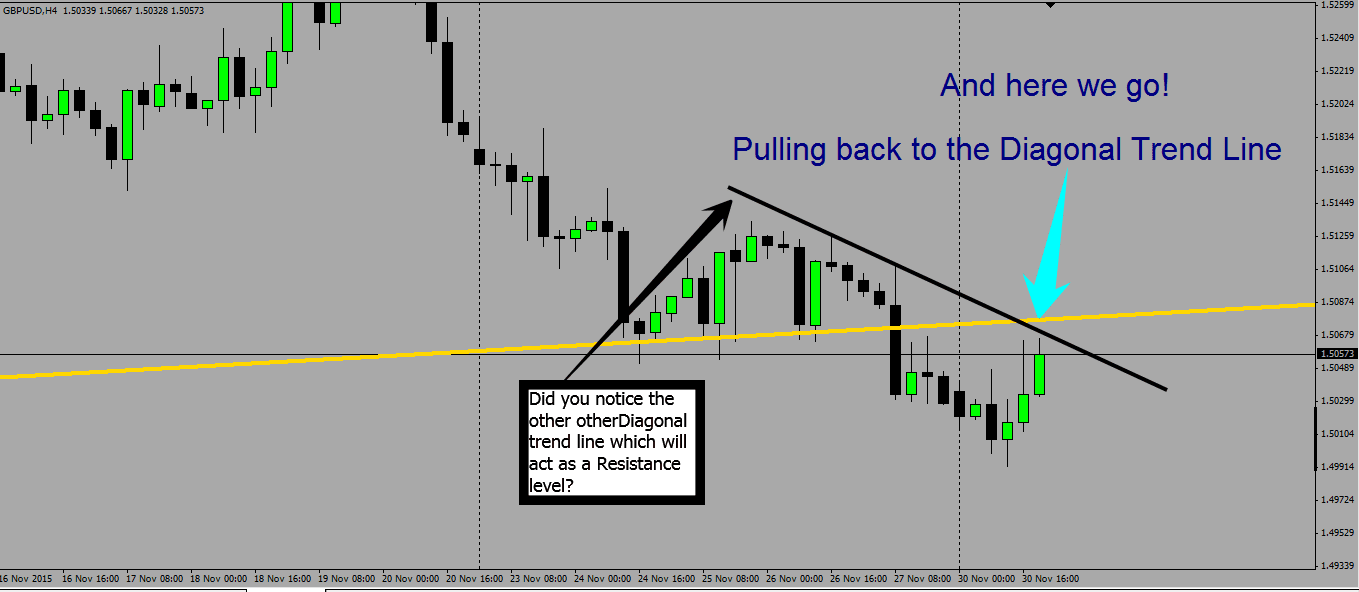
The last post showed the diagonal trend line was penetrated. I said it should do a pullback to the diagonal trend line and then it will tank again. Here is today's picture. I scaled down in the time frame to a 4 hour chart.
The main diagonal trend line is the GOLD line. The black line is for your training - training you to see what the price (and chart) is telling you.
The pair: GPBUSD......
 |
| This is gold boys...study it |
Look at the picture above. I have drawn a gold line and a black line, both are diagonal lines. The gold line is a trend line that I drew using 2 anchor points on a Daily chart. That makes it pretty solid to say the least. It usually (USUALLY) means that the price will go down substantially once that gold line was broken through and the candle closed below it.
The black line I drew on the 4 hour chart. It means that the price will pullback to it and then reverse. But, because the gold line is so close, it may temporarily penetrate the black line to touch the gold line. What's the point?
Some traders will see this pullback as an actual reversal and think that price is now going up and a new bull trade is in play. When actually price should be trying to recover lost ground temporarily and then the BEARS will resume their course.
Price should go down to the 1.49500 area this week. Then? Then we may see the BULLS take over as buying at that level of support would be pretty good.
So if I am correct, how do you trade this? Here's a clue...draw some stinking diagonal trend lines and when price breaks through, go short to 1.49500
Here's a picture for you and where do you think you should draw a diagonal trend line????

So you looked at the picture did you? I gave you the area where price will go to...1.49500, so you have your exit. Where will you get in? Where did you draw your trend line? Answer the question Teddy bear boy!!!!!!!!!!!!!!! Go get some milk and cookies and come back after your "friends" on Fakebook have consoled you...

So where do you get in for your entry? Where did or will you draw your new trend line?
How about a new picture? No more teddy bears for you though, it's time you eats your spinach and man up.

Once it penetrates that AQUA colored line, you may want to consider going short...or not. It really is your decision. But this is a guide to how the big boys trade.
Before you use real money I HIGHLY advise you to practice with a DEMO account. and learn about stop losses.
No comments:
Post a Comment