72% Accuracy rate

Friday, December 25, 2015

Diagonal Trend Lines Plus the Best Indicator? Part 2

Sorry guys, I just can't resist talking about the charts I put up yesterday. Yesterday I put a progressive series of charts using the GPBUSD pair on the DAILY time frame.  The reason I used the DAILY chart is because you get all your trading information from it and then you make your trades based off the information you get from it.

The last chart I used showed a diagonal trend line and a horizontal resistance line. Here it is for a reminder:


As I have stated several times in other posts on this blog, once a candle crosses and closes past a diagonal trend line, normally I will enter on the opening of the next candle. In this case we need extra confirmation due to this being a DAILY chart and the trend is down and could easily drop even more. So I said we needed to add an extra confirmation and it needs to close past the horizontal resistance line...so let's see what happened today.  New picture...


It looks like price spiked up today and then dropped a little.  But the key point here is that it crossed and closed past our diagonal trend line and then hit our horizontal resistance level.

It needs to close above that horizontal resistance level and then it's off to the races for a very nice pullback before resuming its downward course...BENEFIT   FROM   IT.

BTW, I am not telling you what to do. I am showing you how I read a chart and teaching you how I do it. I will tell you this; open a demo account and practice trading with Monopoly money before you use real money.


Wednesday, December 23, 2015

Diagonal Trend Lines Plus the Best Indicator?

I know, some of you think by adding an indicator to your chart you won't be a "real" trader. You go to the message boards and the keyboard warriors bully anyone who uses an indicator. Would they belittle someone on Wall Street? A hedge fund?  No because those message board heroes are nobodys.  Wall Street and hedge fund players use indicators, just look at their screens the next time you see one.

A diagonal trend line is thing of beauty in your trading arsenal. It tells you when to get in or out and what to expect. But sometimes we need confirmation in order to make a decision. An additional clue is okay...show me a cop who determines all his cases on a single clue and I will show you a cop with a very short career.

Therefore we need backup to confirm we are not crazy or seeing things. We never want to buy (go long) at the top of a move/trend, even if it is a small move seen in the lower time frames (5 min, 15 min, 1 hour).

What it Takes to be a GOOD Trader


I want you to get this in your mind right now...you base all of your trades off of the DAILY time frame. Where the DAILY chart is going, that is where you are trading. If it is heading down, trending down, then all of your trades should be going short.  What do I mean? This is gonna get complicated so look at the charts and open your mind. We fail in trading because we see things incorrectly. Why is that? Look at the following chart...


Your baby sister can look at this picture and tell you "it's going down" right? You can draw diagonal trend lines that will clearly indicate that price is going down but you are no longer stupid are you?


Price keeps bouncing back up before it falls even further, and those bounces are big money to the smart trader. So how do we make the best of this opportunity?  How about some more visuals?
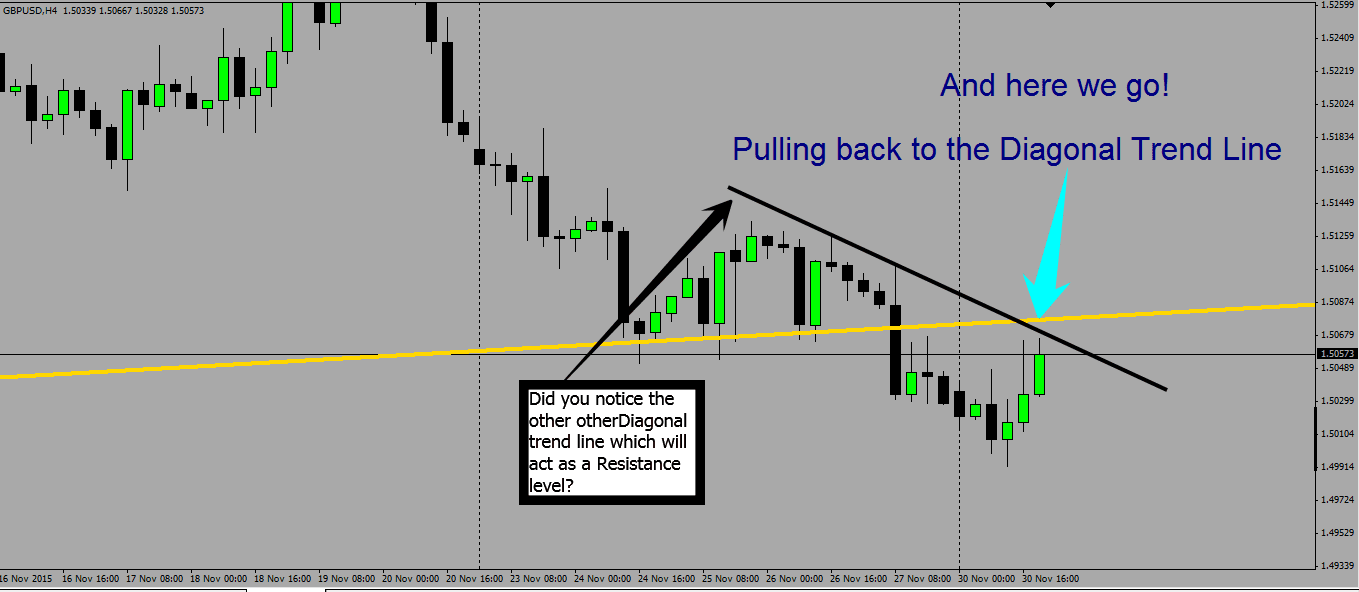
This one will be using a DAILY chart again but we are gonna add a diagonal trend line and I will ZOOM in a bit...

On this next chart I will be using aggressive anchor points, you can be as conservative as you like, but you are not reading this to be conservative. You will see that price broke through my trend line and I had I been short I would have exited. But we are looking at this next chart for the purpose of going long, wanting to capitalize on the price bouncing back up.


Here it is zoomed out...


So we can see that price has possibly halted going down even further and could possibly be ready to do a pullback and go up.  How do we know this? Is there a way we can confirm it? Yes but remember, do NOT make trades based on what you are about to see. This only gives you a "heads up" that price is about to reverse...probably...and you need to do this using the DAILY chart and always draw your trend lines. So what is it?

This oscillator is called Stochastics. Stochastics should be used on the DAILY time frame to allow you to determine near future price reversals. Always use the default settings of 14,3,3 (but use close/close settings)  When you place this on your chart you will need to use your trend lines, and use them aggressively...and do NOT use more indicators.

See if you see things more clearly now...


You see it don't you teddy bear boy? Remember, this is NOT the end all, be all...it just gives you an idea of what is going on. Price may continue to drop even further or it may/probably will go UP very soon as the Stochastics is at the bottom (which means it is in an overbought environment).

Now you need to do 2 more things:
1.  Be ready to go long or BUY
2. draw an aggressive diagonal trend line so let's do that (and now I will zoom in on the existing chart and then drop down to the 1 hour chart for more details)

DAILY chart...


One hour chart...and I took the Stochastics off so you don't get confused...


Now let's put this all together for WHEN you should go long, anticipating price to go up. Remember, price could go down so we do NOT jump in just because our Stochastics tells is price is overbought.

Because this trade will be trading against the overall trend, you should NOT go long (buy) until a candle CLOSES above the black diagonal trend line and the grayed out horizontal line...then you would enter at the opening of the next candle. This would be a double confirmation.


You guys got this? Okay because I am DONE.

Use the Stochastics only as a heads up NOT as a reason to be in a trade. It only tells you that something MAY be coming...it is not reliable for using solely on its own.


Monday, December 21, 2015

the Diagonal Trend Line is King

On Saturday, November 28th, 2015, I pointed out that a MAJOR diagonal trend line had been breached on the Daily chart.  Here is the link to the post, with fancy charts to show you, what had taken place...click on the pretty link --------> winner winner chicken dinner!

Then on Monday, November 30th, 2015, I told you guys to expect it (price, candles) to pullback to the diagonal trend line it had breached.  I also said that once this happens then price would TANK...

And it did.

So to those of you holding your stinkin teddy bears because the Forex market or the stock market has beat you into submission, making you think you are some kind of loser...well, you're not!

You are on the A team now son!  The diagonal trend line is your big brother, your body guard, your insightful uncle, your highly paid financial advisor.

Friday, December 4, 2015

How to Trade Diagonal Trend Lines

I had a thought today that I wanted to share with you about diagonal trend lines. This is extremely important to your development as a trader and this can really save you an enormous amount of frustration.

I want you to think about a wall.  Think about what a stone wall would like that protected a city centuries ago. Or maybe the wall around a castle.

Got it?

Now mentally you have this wall and now picture an invading army attempting to breach it using a battering ram over and over again. The army is trying to breach this wall. If it can get in, it has a chance to defeat and occupy this city.

If the city wall is stout and the city's defenses are intact, the invading army will be repelled and sent packing.

Well fellas, a diagonal trend line is just like that. In the case of going long, the candles go up and hit the resistance levels, the candles will either blow through it (known as a breakout) OR hit it and fall back (known as a reversal).  They will only do one of these 2 things.

So how do you trade when the price (candles) are getting near or touching the diagonal trend line? 


Cautiously.

So the problem of determining whether or not the trend line is going repel price or if price is gonna blow through the wall must be clear when we are trading.  But how? We don't use no crystal ball when we're trading...son!

Simple. Drop down in your time frame to the 1 hour chart (time frame) and draw a box around the candles that are now bunching (consolidating) together, usually right next to the trend line. Draw it around the high and low points of the range. When price determines which way it wants to go, it will explode out of the box you drew...this is known as a "breakout".

These breakouts will then either blow through the trend line or be reversed.  Enter at the very beginning of the second candle.  What is the first candle you ask? It is the candle that blew out of the box you drew.

These breakout from the 1 hour chart can amount to 50 to 200 pips easily.

Here is a video for you guys. I realized that many of you don't have girl friends so here you go, turn your teddy bears away from the monitor.


Monday, November 30, 2015

Using Diagonal Trend Lines in an Actual Trade

I realize that last post showing the picture of Tyler Durden may have frightened some of you, others got inspired.  You frightened ones, grab your Teddy bears and some tea.  We can bring you around to be mean enough to tackle the Forex market.

Today's post will fire you boys UP!!!

The last post showed the diagonal trend line was penetrated.  I said it should do a pullback to the diagonal trend line and then it will tank again.  Here is today's picture.  I scaled down in the time frame to a 4 hour chart.

The main diagonal trend line is the GOLD line.  The black line is for your training - training you to see what the price (and chart) is telling you.

The pair:  GPBUSD......

This is gold boys...study it


So, I ask you this...where will price go after the pullback? Many traders will get caught up in the pullback trap.  What is the pullback trap?

Look at the picture above.  I have drawn a gold line and a black line, both are diagonal lines.  The gold line is a trend line that I drew using 2 anchor points on a Daily chart.  That makes it pretty solid to say the least.  It usually (USUALLY) means that the price will go down substantially once that gold line was broken through and the candle closed below it.

The black line I drew on the 4 hour chart. It means that the price will pullback to it and then reverse.  But, because the gold line is so close, it may temporarily penetrate the black line to touch the gold line.  What's the point?

Some traders will see this pullback as an actual reversal and think that price is now going up and a new bull trade is in play.  When actually price should be trying to recover lost ground temporarily and then the BEARS will resume their course.  

Price should go down to the 1.49500 area this week.  Then?  Then we may see the BULLS take over as buying at that level of support would be pretty good.

So if I am correct, how do you trade this?  Here's a clue...draw some stinking diagonal trend lines and when price breaks through, go short to 1.49500

Here's a picture for you and where do you think you should draw a diagonal trend line????


So you looked at the picture did you?  I gave you the area where price will go to...1.49500, so you have your exit.  Where will you get in?  Where did you draw your trend line?  Answer the question Teddy bear boy!!!!!!!!!!!!!!!  Go get some milk and cookies and come back after your "friends" on Fakebook have consoled you...


So where do you get in for your entry? Where did or will you draw your new trend line?

How about a new picture?  No more teddy bears for you though, it's time you eats your spinach and man up.


Once it penetrates that AQUA colored line, you may want to consider going short...or not.  It really is your decision. But this is a guide to how the big boys trade.

Before you use real money I HIGHLY advise you to practice with a DEMO account. and learn about stop losses.


Saturday, November 28, 2015

Diagonal Trend Lines, the Proof

Do Diagonal Trend Lines Work?

So you are skeptical whether a diagonal trend line works are you? You better be. The thing to remember is that a line, whether it be a horizontal line or a diagonal line, is either a support or resistance area.

A line is gonna be tested. It will either hit it and reverse or hit it and go through it. Rocket science? No but we dang sure find a way to make it hard don't we? Here is some good advice...

Stop over complicating it.

Tyler Durden approved


Now let's look at a chart. The other day I posted a chart where the price was hitting the diagonal support line. It was either gonna bounce off of it or penetrate it. So let's see what it did.

Again, Daily chart.  GBPUSD pair


You're gonna need to click on the picture to make it bigger so you can see it but here's the deal...it broke through support so now it will drop much more. Expect a pullback which should go back up to the diagonal trend line but not penetrate it then really drop nicely.


Tuesday, November 24, 2015

Diagonal Trend Lines as Support and Resistance

Diagonal Trend Lines give Direction

Diagonal trend lines are extremely important because they can tell you when to get in or out of a trade. Always remember to check your diagonal trend lines before you get in or out of a trade.  

In my last post about Support and Resistance, I discussed how a horizontal line can show you where the price (the candles) will go.  

As you probably remember, using the analogy of a house, resistance is like your ceiling and support is like the floor of your house. Jump too high and you will hit your head on the ceiling (resistance) and you will fall down and lay on the floor (support) glad that you did NOT continue to fall even further.

Our first picture will show where price (I use candles) came down today, stopped, and then reversed and went back up...What caused it to stop and not continue falling?


Buy Low, Sell High with Diagonal Trend Lines


This is a Daily chart using the GBPUSD currency pair.


You can see that price halted and reversed but why? If you draw a horizontal line it makes no sense. You see the horizontal price line (in black) is above the most recent "swing low" so why didn't it just drop to that point?  Seasoned traders will immediately say that it is a pullback before it drops more.  Well, I say maybe...maybe not.

Now let's draw a diagonal trend line and see if it gives us another trading clue on the same chart.

Same criteria and pair...Daily time frame on the GBPUSD


And there we get an idea (crowd mentality or psychology, whatever you want to call it) of a reluctance for traders going short to hold their positions. Because it is a diagonal support line it very well may just bounce off of that line and become a LONG play. If you had gone short you may just take your profits and wait to see if it will continue/resume its downward course or reverses its course and begins to go up. 

I prefer the profits over regrets.